News by tag
Visamic MQTT IoT Dashboard Service
The Visamic IoT Dashboard Web Service enables users to monitor and interact with connected things and sensors through charts and other data visualisations in real-time, for exploration and analysis.
Based on the industry standard MQTT protocol, it's available for you to set up a no-cost user account to try it out either with your own MQTT connected devices data or to view the prepared demos.
Visit the Visamic page to learn more.

Announcing the new Visamic MQTT IoT Dashboard Service
We're pleased to announce the availability of the Visamic IoT Dashboard service, based on the MQTT protocol. The service is in BETA mode and still subject to change but it is available for you to set up a no-cost user account to try it out either with your own MQTT sensor data or to view the prepared demos.
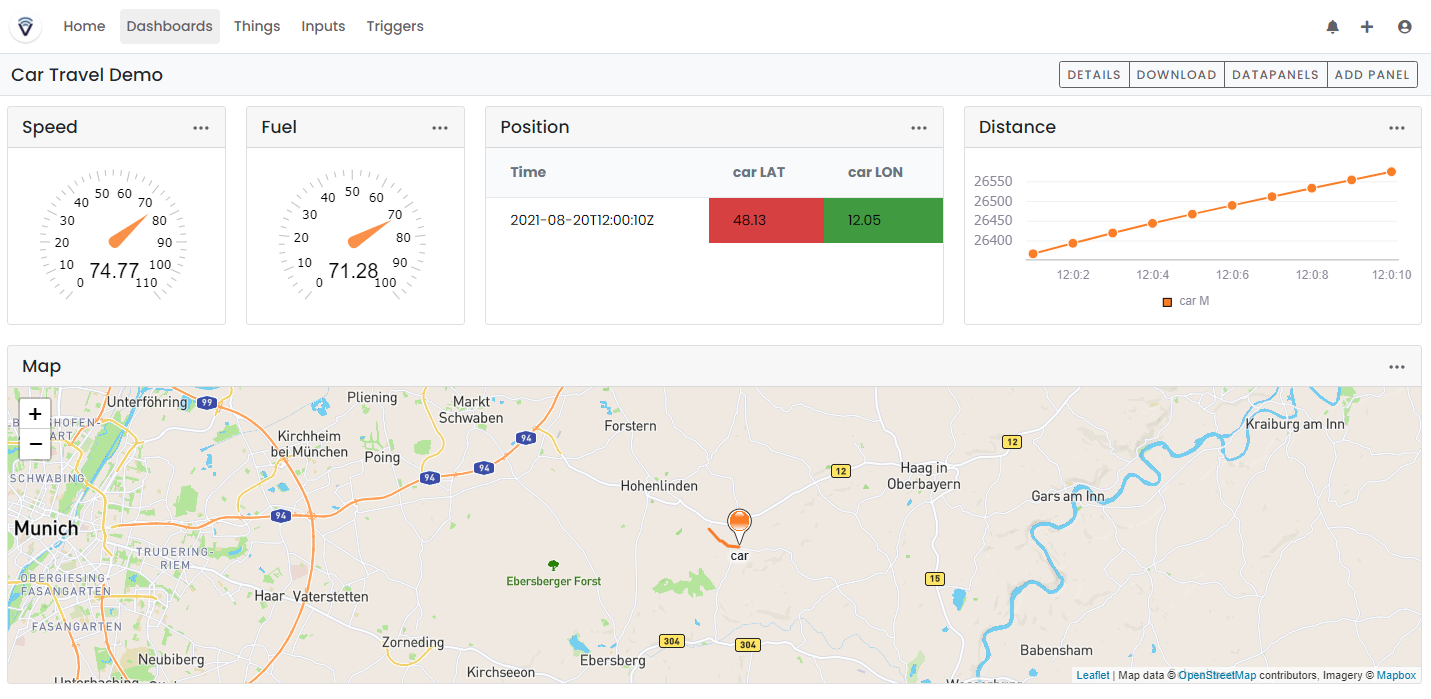
If you'd like to quickly view an existing demo, when you enter, click on the user icon on the right of the screen (![]() ) and select "demos".
) and select "demos".
TCoffeeAndCode - Data Visualizations (re-visualized)
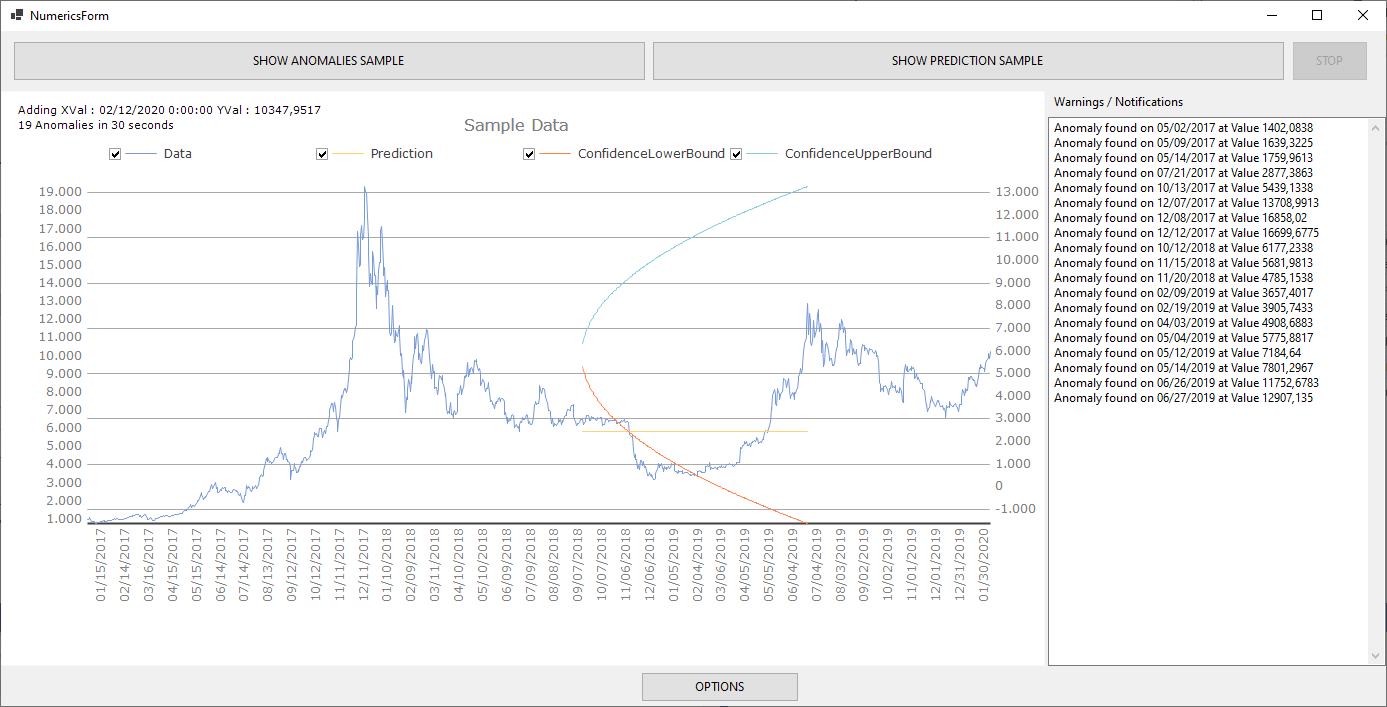
Steema Numerics predictive & anomaly detection for TeeChart
Presenting the Visamic preview
TeeGrid for VCL/FMX [19 DEC 2018] RELEASE 1.07
Announcing the availability of the latest TeeGrid for VCL/FMX 1.07 release with full RAD Studio 10.3 Rio (RX/DX/CX) support.
3rd Edition of JOIN! – The Database Conference Coming in November!
TeeGrid for VCL/FMX [18 JUL 2018] RELEASE 1.06
Announcing the availability of the latest TeeGrid for VCL/FMX 1.06 release with added support for JSON export.
Official Release of TeeGrid for .NET
TeeGrid for .NET Beta Release
TeeGrid for .NET Beta Release
TeeGrid for VCL/FMX [23 MAR 2018] RELEASE 1.05
Announcing the availability of the latest TeeGrid for VCL/FMX 1.05 release with full RAD Studio 10.2 Tokyo Update 3 (RX/DX/CX) support.
TeeGrid for VCL/FMX [17 JAN 2018] RELEASE 1.04
Announcing the availability of the latest TeeGrid for VCL/FMX 1.04 release with full RAD Studio 10.2 Tokyo Update 2 (RX/DX/CX) support.
TeeGrid for VCL/FMX [31 OCT 2017] RELEASE 1.03
Announcing the availability of the latest TeeGrid for VCL/FMX 1.03 release.
TeeGrid for VCL/FMX [6 APR 2017] RELEASE 1.02
Announcing the availability of the latest TeeGrid for VCL/FMX 1.02 release with full RAD Studio 10.2 Tokyo (RX/DX/CX) support.
TeeGrid for VCL/FMX [1 MAR 2017] RELEASE 1.01
Steema is pleased to inform you of the availability of TeeGrid for VCL/FMX v1.01 release.
TeeGrid Grid Component for Delphi VCL and FMX now released
TeeChart and Big Data
Introducing Tee.Data, TeeChart's Javascript data pivot library
Clustering data
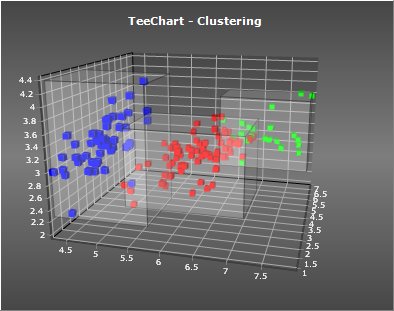
This TeeChart VCL preview demo includes classes and components to perform "clustering" on your data. Clustering is the process of grouping data according to how well related the individual items are. See http://en.wikipedia.org/wiki/Cluster_analysis for more information.
The linked demo, http://www.steema.us/files/public/teechart/vcl/demos/clustering/TeeChart_Clustering.zip, is a working example that uses a TeeChart to chart clustered data.
See the background information in this document for more information.

