close×

.NET Chart controls
for Mobile, Desktop
and Web Apps

Comprehensive C# chart library, highly qualified data visualisation
Includes .NET 8.0 support

Blazor demo

See demos
Overview

TeeChart .NET charting controls offer a great generic component suite for a myriad of charting requirements, targeting important vertical areas such as the financial, scientific and statistical worlds.

Data Visualisation

Dozens of fully customizable and interactive chart types, maps and gauge indicators, plus complete featureset to help build powerful c# charting apps for web, desktop and mobile.

Easy to Use

You'll see how easy it is to code TeeChart and how you can improve department development productivity. Full c# chart source code available.

Priced Right for You

We offer Business, Professional and Enterprise Editions to better fit your needs and budget.

A Superlative in Charting

With over 28 years of charting development behind TeeChart, it is simply one of the most extensive charting libraries for .NET that you can lay your hands on.

A quick glance

Flexible data visualisation

For WinForms, WPF, ASP.NET, Blazor, .NET MAUI and Xamarin
The .NET charting component handles your data, creating informative and attractive graphs, seamlessly across a variety of platforms including: Windows Forms, WPF, Blazor, ASP.NET with HTML5 /JavaScript rendering and on mobile platforms.

The c# chart library code may be reused with Steema's mobile TeeChart products for Xamarin to reach Android, iOS and UWP via .NET MAUI or Xamarin.

WinForm bar chart Informative data visualisation represented by stacked bar charts in Windows Forms and UWP.

.NET Financial Charts Point & Figure graph. Point & Figure is made of X's and O's symbols representing over time filtered price movements.

Tracking financial data

Many mathematical indicators, statistical functions and more
The .NET chart control is packed with functionality to produce high-class financial charting applications. Functions and indicators include: Open-High-Low-Close Series, Candle, Volume and Moving Average Convergence/Divergence (MACD), ADX, Stochastic, Bollinger Bands, Renko, Kagi, Momentum, Moving Average and many more statistical functions.

Web charts - Blazor - MVC

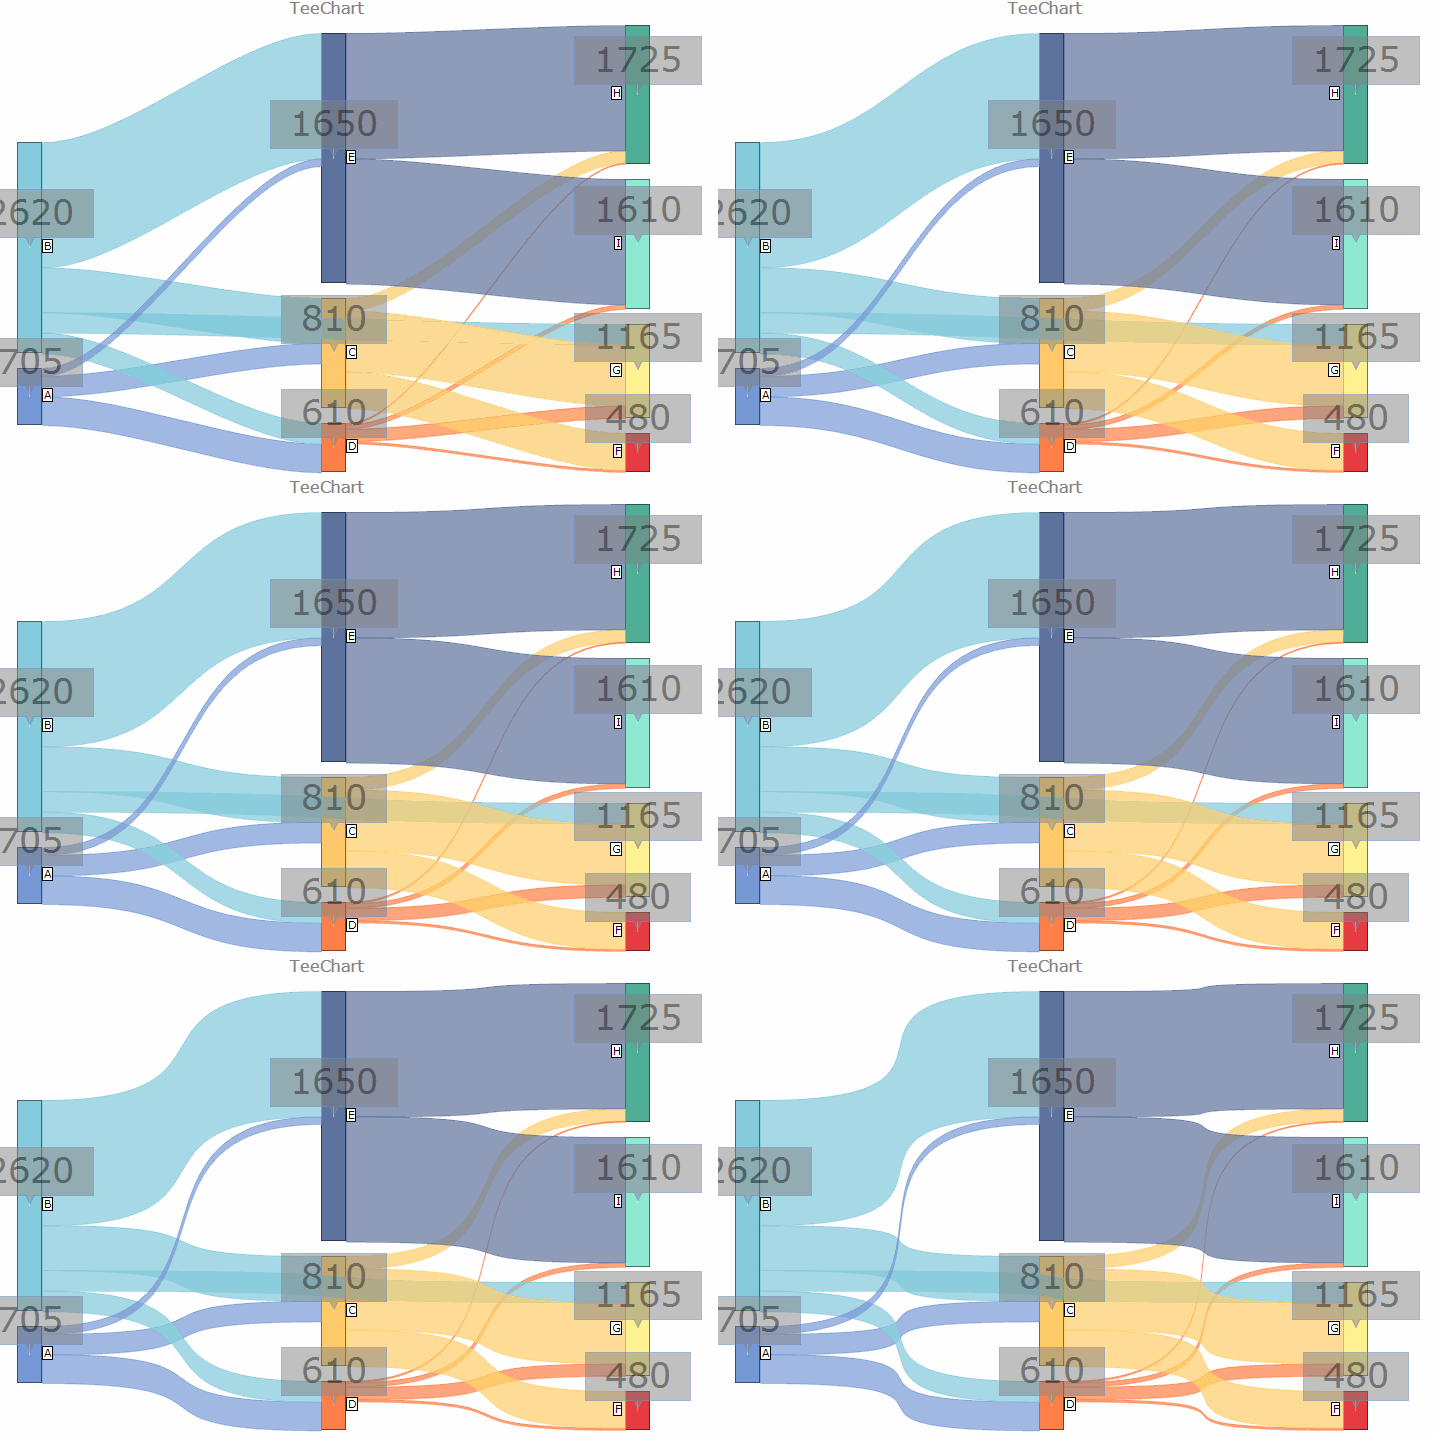
ASP.NET Core, MVC & Blazor charts as HTML5 JavaScript
The ASP.NET Web chart control may be placed on the WebForm panel for full in-place editing or be used within an MVC Blazor project. You can render your web charts either as static or ajax enhanced images or take advantage of TeeChart's comprehensive, client-side HTML5 JavaScript library to render fully interactive .NET charts for MVC & ASP.NET.
See this demo where you will find interactive charts for Blazor.

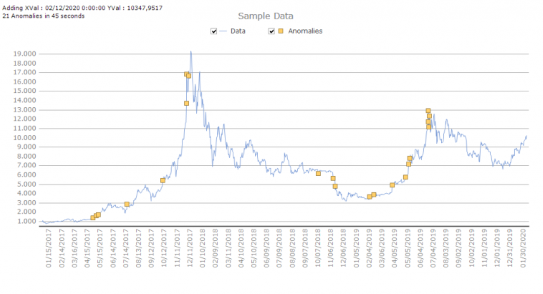
Anomaly Detection in .net chart Chart plots anomalies detected in data using TeeChart & Steema Numerics with ML.Net.

Predictive & Anomaly Detection

Machine Learning algorithm interface for the Chart for .NET
We have prepared a module to link directly to Microsoft's ML.Net Machine-Learning framework with prepared and optimised predictive and anomaly detection algorithms. Save valuable learning-curve time delivering data insight to your customers.
See the blog article and Steema Numerics page to learn more.


Features

New and improved features

(Current build: 2024.10.18, Other Version history)

- Fully exploits Microsoft.NET Framework 2.0, 3.5, 4.xx, .NET Standard /.NET Core 2 & 3 on Winforms, WPF & ASP.NET, .NET 5, .NET 6, .NET 7, .NET 8
- ASP.NET Framework 2.0 and higher
- Windows Presentation Foundation (WPF)
- Compatible with Microsoft Visual Studio: 2005, 2008, 2010, 2012, 2013, 2015, 2017, 2019, 2022
- Components for WinForms, WebForms, MVC
- Universal Windows Platform (UWP)
- HTML5 support browsers
- Ajax clientside WebChart processing
Support for Android, iOS and UWP via the .NET MAUI and Xamarin products included with the Enterprise Edition.
60+ chart types and variations. From the commonly used Line, Bar, Area, Pie to those more "field-specific charts" such as Candlestick, Open-High-Low-Close, Kagi and Contour.
Includes:
- Standard: Line (Strip), Bar, Area, Pie, Fast Line, Point (Scatter), Bubble, Arrow, Gantt, Shape, Horiz.Area, Horiz.Bar, Horiz.Line, Pointer style Hexagon
- Financial: Candle (OHLC), Darvas, Kagi, Renko, Point and Figure, Volume, EquiVolume
- Statistical: Box-Plot, Color Grid, Error, Error Bar, Error Point, Funnel (Pipeline), HighLow, Histogram, Volume Pipe, Waterfall, Horiz. BoxPlot, Horiz. Histogram, Violin, BeeSwarm, Horiz. Violin, Horiz. BeeSwarm
- Extended: 3D Vector, Bezier, Contour, Donut, IsoSurface, Map GIS, Organizational Chart, Polar, Polar Grid, Point 3D, Pyramid, Radar, Smith, Surface, TreeMap, Tri.Surface, Tower
- Other: Bar 3D, Bar-Join, Calendar, Clock, Image Bar, Image Point, My Point, TagCloud, Wind-Rose, BubbleCloud
Gauges series type and indicators (dynamic Gauges, Circular, Linear, Numeric, Knob or Combination). TeeChart's Gauges are completely configurable to give you full control of format, size, colour and shape for your dashboard application.
Provides library of map series with support for ESRI open standard map formats.
50+ financial and statistical indicators including:
- Standard: Add, Subtract, Multiply, Divide, Count, Average, High, Low, Median Function, Percent Change
- Financial: ADX, AC, Alligator, AO, ATR, Bollinger Bands, CCI, CLV, Compression OHLC, Exp. Average, Exp. moving average, Gator Oscillator, Kurtosis, MACD, Momentum, MomentumDiv, Money Flow, OBV, PVO, RSI, RVI, Slope, Smoothed Mov Avg, S.A.R Function
- Statistical: SPC Charts, Histograms, Skewness, Lagrange, Kernel-Density Estimator (KDE)
- Extended: Cross points, Correlation, Cumulative, Custom y=y(x), Exponential Trend, Fitting linearizable models, Performance, Perimeter, Polynomial fitting, Finding coefficients, Reducing number of points, DownSampling, RMS, Smoothing function, Std Deviation, Trendline, Variance
- Steema Numerics: Predictive and anomaly detection algorithm interface to ML.Net. See linkIn/numerics for more information.
You can easily create and/or connect to an existing database or dataset in your project.
Direct access to .NET data sources. Direct access to URL addressable Charts.
TeeChart includes a set of 43 tools:
Annotation, ExtraLegend, GridBand, MarkTip, NearestPoint, SeriesAnimation, Rotation, ColorLine, DragPoint, Zoom, Scroll, ChartImage, GridTranspose, PageNumber, Pie, LegendScrollBar, SurfaceNearest, Cursor, DragMarks, AxisArrow, ColorBand, DrawLine, Gantt, AxisScroll, Light, Fibonacci, SubChart, Marker, Fader, Rectangle, Selector, SeriesRegion, LegendPalette, SeriesStats, SeriesTranspose, DataTable, ClipSeries, Banner, CustomHotspot, AxisBreaks, ScrollPager, FullScreen, CycleLines.
The Palette provides access to 30 toolkit-specific components including ChartGrid, Navigators, Web source and Control Bar.
You have control over the aesthetics of the charts with a set of 25 image filters.
You can easily export charts as images (bitmap, metafile, JPEG, PNG, GIF, TIFF, PDF, SVG, EPS and native Chart format) and as data to Excel, XML, HTML, CSV (Text) and native Chart format. Builds and exports to Flash via Flex compiler. Stream export/import capability for BLOB storage and direct output to client (eg. browser).
TeeChart for .NET includes native support to create JavaScript charts for an HTML5 Canvas. It does so by referencing, at runtime, the publicly available TeeChart HTML5 minified source at the Steema web (/files/public/teechart/html5/latest/src). You are free to enhance your clientside code using this repository.
TeeChart JavaScript sourcecode, supported by Steema, is available here /product/html5, or the open source version is accessible at github.com.
Enterprise Edition includes the TeeChart JS Subscription License.
TeeChart forms and string constants translated to 29 languages. The translation can be used at design-time and run-time.
Direct high-speed addition of Array data to the Chart making TeeChart for .NET very quick! Very quick!
TeeChart now ships with a Direct2D rendering engine. This is ideal for the high speed data throughput required by DSP realtime applications. See this Whitepaper Direct2D.
Use the Chart Editor to add and setup Multiple Axes or add them at runtime. Virtually unlimited Axes may be added and independently configured.
Charts can be scrolled and zoomed using the mouse or by code at runtime. Zoom and scroll features can be customized using chart properties and events.
Includes 14 predefined themes enabling rapid change of many chart properties with a single mouse click.
Colour palette management, Transparency and anti-aliasing on all Chart object Pens, Brushes, Fonts and Gradients. Custom 3D Drawing Objects.
Tech support provided via Steema online Forums. Optional Professional-level technical support gives the subscriber a priority support link into Steema.
You may distribute your charts royalty-free for use in compiled desktop applications.
See the Software licensing contract to learn more about the use of TeeChart for .NET license.
Includes extensive demos for Visual Studio.NET including WinForms, WPF, ASP.NET WebForms, coded examples, Tutorials, Blog articles, etc.
Compare features between the Business, Pro and Enterprise Editions via the Feature Comparison table.
Pricing

New License of 2024

Perpetual License. Includes one year subscription

Includes full Sourcecode and sourcecode installers for TeeChart for Xamarin and JS products


$1704

Perpetual License. Includes one year subscription

Includes these products:

TeeChart Pro for .NET,  Xamarin .iOS, .Android & .Forms, .NET MAUI plus TeeChart JS

$868

Perpetual License. Includes one year subscription

Includes standard chart types & gauges for desktop & web

$318

Perpetual License. Includes one year subscription

Includes these products:

TeeChart Pro for .NET

$648

Upgrade to 2024

Upgrade from
To Version 2024 and one year subscription
$989
Upgrade from
To Version 2024 and one year subscription
$520
Upgrade from
To Version 2024 and one year subscription
$184
Upgrade from
To Version 2024 and one year subscription
$382

Subscription Renewal for 2024

Subscriptions include all major and minor version releases and forum support

One Year support and major version upgrade protection subscription renewal
$767
One Year support and major version upgrade protection subscription renewal

Includes these products:

TeeChart Pro for .NET, Xamarin .iOS, .Android & .Forms, MAUI plus TeeChart JS

$391
One Year support and major version upgrade protection subscription renewal
$144
One Year support and major version upgrade protection subscription renewal
$296
Additional options
$249

.NET news

Previous .NET news

Volume discounts

We offer discounts when purchasing more than one license. Discounts are as follows:

  • 2 Licenses: 5% discount
  • 5 Licenses: 20% discount
  • 10 Licenses: 25% discount

The volume discount will be automatically calculated if you are making your order online. You just need to enter the quantity of licenses you want to order. For special requirements, please contact us at sales@steema.com

Perpetual Licenses and Subscriptions

Steema Licenses are perpetual and sold on a subscription basis. The subscription period is initially for 12 months, renewable annually and includes access to updates and support forums. Please see the Subscription licensing page for complete details.
When the subscription period expires you can optionally renew your subscription for an additional year at the renewal price. We will notify you via e-mail at least 30 days prior to the expiry date.
If your subscription has lapsed over 30 days, the renewal price will not apply and the cost will be that of a license upgrade price.

If you have a question or require more information, call us at +34 972 218 797 between 9:00h and 17:00h central european time or email sales@steema.com