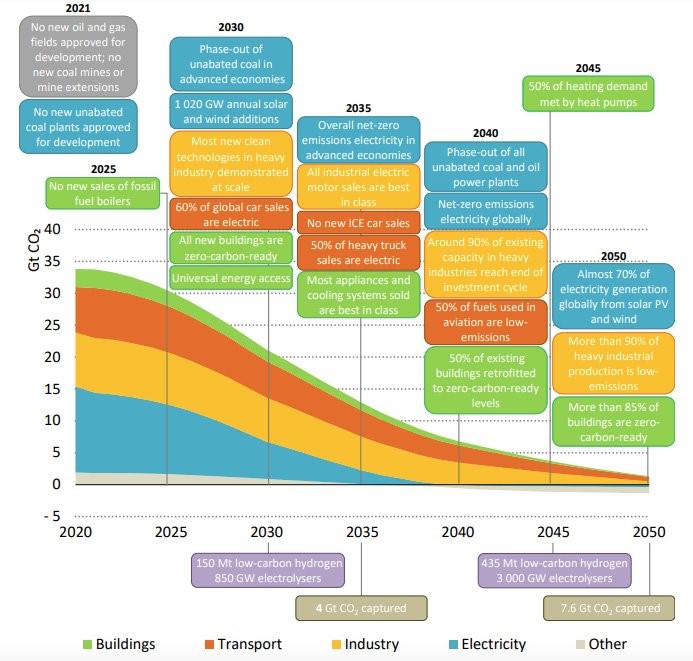
Specifically, I'm looking to be able to add "milestones" to a chart that has years on the X axis, with the color of each milestone set the same as the legend series. Any pointers on how one might do this gratefully accepted.
Thanks in advance!


TAnnotationTools to draw both the text shapes at the top and at the bottom.Code: Select all
uses Series, TeeTools;

procedure TForm1.FormCreate(Sender: TObject);
var i, j: Integer;
begin
  Chart1.Align:=alClient;
  Chart1.Gradient.Visible:=False;
  Chart1.Color:=clWhite;
  Chart1.Walls.Back.Gradient.Visible:=False;
  Chart1.Walls.Back.Color:=clWhite;
  Chart1.Walls.Back.Visible:=False;
  Chart1.Legend.Hide;
  Chart1.View3D:=False;

  for i:=0 to 4 do
    with TAreaSeries(Chart1.AddSeries(TAreaSeries)) do
    begin
      XValues.DateTime:=True;
      FillSampleValues;
      for j:=0 to Count-1 do
        XValues[j]:=StrToDate('1/1/'+IntToStr(2021+j));

      MultiArea:=maStacked;
      Smoothed:=True;
      AreaLinesPen.Hide;
    end;

  Chart1.MarginTop:=30;
  Chart1.Axes.Bottom.DateTimeFormat:='yyyy';

  Chart1.Draw;

  with TAnnotationTool(Chart1.Tools.Add(TAnnotationTool)) do
  begin
    Text:='This is another text'+sLineBreak+'for 2021';
    Shape.ShapeStyle:=fosRoundRectangle;
    Shape.Margins.Left:=20;
    Shape.Margins.Right:=20;
    Shape.Margins.Top:=10;
    Shape.Margins.Bottom:=10;
    Shape.Color:=Chart1[0].Color;
    Shape.Font.Color:=clWhite;
    Shape.Font.Style:=Shape.Font.Style+[fsBold];
    Left:=Chart1.Axes.Bottom.CalcPosValue(StrToDate('1/1/2021'));
    Top:=Chart1.ChartRect.Top-Bounds.Height-20;
  end;
  with TAnnotationTool(Chart1.Tools.Add(TAnnotationTool)) do
  begin
    Text:='This is some text'+sLineBreak+'for 2021';
    Shape.ShapeStyle:=fosRoundRectangle;
    Shape.Margins.Left:=20;
    Shape.Margins.Right:=20;
    Shape.Margins.Top:=10;
    Shape.Margins.Bottom:=10;
    Shape.Color:=Chart1[1].Color;
    Shape.Font.Color:=clWhite;
    Shape.Font.Style:=Shape.Font.Style+[fsBold];
    Left:=Chart1.Axes.Bottom.CalcPosValue(StrToDate('1/1/2021'));
    Top:=TAnnotationTool(Chart1.Tools[0]).Top-Bounds.Height-10;
  end;
  with TAnnotationTool(Chart1.Tools.Add(TAnnotationTool)) do
  begin
    Text:='2021';
    Shape.Shadow.Hide;
    Shape.Pen.Hide;
    Shape.Font.Style:=Shape.Font.Style+[fsBold];
    Left:=Chart1.Axes.Bottom.CalcPosValue(StrToDate('1/1/2021'));
    Top:=TAnnotationTool(Chart1.Tools[1]).Top-Bounds.Height-10;
  end;
end; | Yeray Alonso Development & Support Steema Software Av. Montilivi 33, 17003 Girona, Catalonia (SP) |
      |
Please read our Bug Fixing Policy |
