Page 1 of 1
Propability plots
Posted: Thu Nov 20, 2003 8:53 am
by 4212797
I need propability plots to show a normal distribution or a weibull distribution and so on.
Greetings Heinz
Posted: Mon Nov 24, 2003 5:46 pm
by Marjan
Hi, Heinz.
Using the latest TeeChart version which supports custom axis labels (text and position for individual labels) implementing any non-linear plot should be easy. All you need is transformation for values and labels.
I've implemented it for normal, Weibull and Q-Q plots. I'll prepare an article about this shortly and post it here.
qq plots etc
Posted: Tue Oct 19, 2004 6:13 pm
by 9336948
Posted: Thu Aug 17, 2006 7:05 pm
by Marjan
Hi.
Sorry about (long) delay. I've implemented some of the probabilities plots (among other addditional statistical charts) for another statistical library I'm working on. Some images are available at
http://www.dewresearch.com/StatsSeriesGallery.html. In case you're interested I can send you full C# sources (for TeeChart .NET).
probability plots with teechart
Posted: Tue Feb 27, 2007 9:00 pm
by 9336948
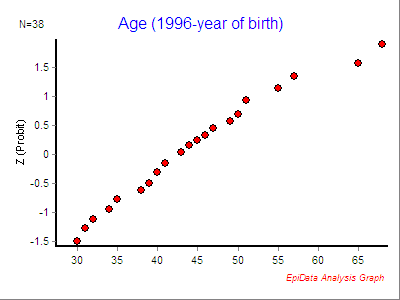
I have now implemented probability plots in EpiData using a standard point series of teechart. The sequence is:
1. create a series with cumulative percentages
.. xvalues cumpercentage
2. convert to probabilities, e.g. see
.. xvalues cumprob
Bland M: Introduction to Medical Statistics. Oxford, 2nd ed. p 112.
3. find an inverse normal function for the probabilites
yvalue = inverse normal (cumprob)
(search internet for "normal probability .....source code", you will get several hits., e.g. "normal probability pascal source"
4. create a standard TChart with a pointseries and do a addxy(xvalues yvalue) and you have the normal probability plot
For a test users can download an application at:
http://www.epidata.dk - general download page later or currently:
http://www.epidata.dk/testing.php
example:

Posted: Mon Oct 01, 2007 1:48 pm
by 9637610
Marjan wrote:Hi.
Sorry about (long) delay. I've implemented some of the probabilities plots (among other addditional statistical charts) for another statistical library I'm working on. Some images are available at
http://www.dewresearch.com/StatsSeriesGallery.html. In case you're interested I can send you full C# sources (for TeeChart .NET).
Marjan,
I would be very interested in the QQ-plot code. Would you be able to send me a copy?
Cheers
Francis
Posted: Tue Oct 02, 2007 11:13 am
by narcis
Hi Francis,
Marjan told me that he uses some specialized code to calculate each point Q-Q value so it's a bit difficult to split it into a simple unit. But basically he's using the same approach other customer reported (epidata). He's doing normal probability plot, but if you omit the normalcdf calculation on y values, you'll end up with Q-Q chart.
