TeeChart VCL for Borland/CodeGear/Embarcadero RAD Studio, Delphi and C++ Builder.
-
MHotz
- Newbie

- Posts: 9
- Joined: Thu Apr 07, 2011 12:00 am
-
Contact:
Post
by MHotz » Mon Oct 24, 2011 3:40 pm
Hello,
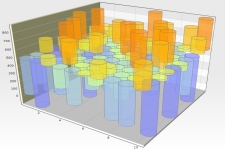
is it possible to create a chart that looks similar to that one I attached as an image? I mean the cylinder only. The tube surrounding the cylinder could be a backimage. I tried the cylinder series type but that doesn't look so smooth as in the image. And we don't want to use neither Open GL nor GDI+.

Thanks for your support!
Regards Markus
-
Yeray
- Site Admin

- Posts: 9710
- Joined: Tue Dec 05, 2006 12:00 am
- Location: Girona, Catalonia
-
Contact:
Post
by Yeray » Tue Oct 25, 2011 7:53 am
Hello Markus,
I'm afraid the smoothed curves is one of the GDI limitations.
Here you have the results I get with GDI, GDI+ and GDI&AntiAliasTool.
Code: Select all
procedure TForm1.FormCreate(Sender: TObject);
begin
  Chart1.Chart3DPercent:=100;

  with Chart1.AddSeries(TBarSeries) as TBarSeries do
  begin
    FillSampleValues();
    BarStyle:=bsCilinder;
    MultiBar:=mbSelfStack;
    Marks.Visible:=false;
    ColorEachPoint:=true;
    Dark3D:=false;
  end;
end;

- CylinderGDI.png (8.33 KiB) Viewed 14883 times

- CylinderGDIPlus.png (18.07 KiB) Viewed 14870 times

- CylinderAntiAliasTool.png (12.76 KiB) Viewed 14876 times
-
MHotz
- Newbie
- Posts: 9
- Joined: Thu Apr 07, 2011 12:00 am
-
Contact:
Post
by MHotz » Thu Oct 27, 2011 11:30 am
Thanks for your Reply!
But how was this chart
created? This is an example from the steema gallery. Theses are also cylinders but they look very much better than the regular cylinder bar chart. Using the regular cylinder bar chart one have very few options to change the look of the cylinders. E.g. using a gradient fill.
Thanks again for your help!
Greetings Markus
-
Yeray
- Site Admin
- Posts: 9710
- Joined: Tue Dec 05, 2006 12:00 am
- Location: Girona, Catalonia
-
Contact:
Post
by Yeray » Thu Oct 27, 2011 2:34 pm
Hello
This example from the gallery was made with TeeChart .NET and some of Micrsoft .NET Framework drawing techniques are not available in the VCL framework.
However, with GDI+ and the following code I get a quite similar result:

- Tower.png (197.63 KiB) Viewed 14865 times
Code: Select all
uses TeeSurfa, TeeGDIPlus, TeeTools;

procedure TForm1.FormCreate(Sender: TObject);
begin
  with TTeeGDIPlus.Create(self) do
  begin
    TeePanel:=Chart1;
    Active:=true;
  end;

  Chart1.Title.Visible:=false;
  Chart1.Chart3DPercent:=100;
  Chart1.Legend.Visible:=false;
  Chart1.Aspect.Orthogonal:=false;
  Chart1.Aspect.Zoom:=70;
  Chart1.Aspect.Rotation:=325;
  Chart1.Aspect.Elevation:=340;
  Chart1.Walls.Left.Size:=10;
  Chart1.Walls.Bottom.Size:=10;

  with Chart1.Tools.Add(TGridBandTool) as TGridBandTool do
  begin
    Axis:=Chart1.Axes.Left;
    Band1.Color:=clGrayText;
    Band1.Transparency:=50;
    Band2.Transparency:=50;
  end;

  with Chart1.AddSeries(TTowerSeries) as TTowerSeries do
  begin
    FillSampleValues();
    Origin:=YValues.MinValue+(YValues.MaxValue-YValues.MinValue)/2;
    UseOrigin:=true;
    TowerStyle:=tsCylinder;
    Marks.Visible:=false;
    Dark3D:=false;
    Transparency:=30;
    UseColorRange:=false;
    UsePalette:=true;
  end;
end;
-
MHotz
- Newbie
- Posts: 9
- Joined: Thu Apr 07, 2011 12:00 am
-
Contact:
Post
by MHotz » Fri Oct 28, 2011 11:36 am
Hi Yeray,
thank you very much for your in depth answer! No I see things clearer

.
I decided to go another way and for that I need one more information. How can I get the exact position of a single series value point? I mean the X and Y coordinates and the Height and Width of a column that was drawn by the chart.
Thanks again for your help!
-
Yeray
- Site Admin
- Posts: 9710
- Joined: Tue Dec 05, 2006 12:00 am
- Location: Girona, Catalonia
-
Contact:
Post
by Yeray » Fri Oct 28, 2011 3:04 pm
Hello,
Check the series' CalcXPos and CalcYPos functions.
-
MHotz
- Newbie
- Posts: 9
- Joined: Thu Apr 07, 2011 12:00 am
-
Contact:
Post
by MHotz » Fri Oct 28, 2011 3:33 pm
That's ok. And the Height and Width of a value point? Or the Right and Bottom Coordinates? Are theses values also available? I want to know the BoundsRect of a value point (e.g. Bar)
Greetings Markus
-
MHotz
- Newbie
- Posts: 9
- Joined: Thu Apr 07, 2011 12:00 am
-
Contact:
Post
by MHotz » Sat Oct 29, 2011 7:28 pm
Hi Yeray,
I moved a bit further. I found out how to get the BoundRect of a TBarSeries. So I am able to cover a bar with images so that I receive the result I want. But now I have another problem. I want to export my chart to a png file. The chart contains some png images with alpha channel. Exporting the chart to png in
Delphi 2010 all works fine as you can see in that image

But If I do the same with the same code in
Delphi 2007 the result looks like this:

I am using the following code to do the export
Code: Select all
    tmp := TPNGExportFormat.Create;
    tmp.Panel := Chart1;
    tmp.SaveToFile(ChartImageFile);
    tmp.Free;
Any idea? What's differnt in D 2007?
-
Narcís
- Site Admin
- Posts: 14730
- Joined: Mon Jun 09, 2003 4:00 am
- Location: Banyoles, Catalonia
-
Contact:
Post
by Narcís » Mon Oct 31, 2011 4:08 pm
Hi Markus,
Are you using exactly the same version in both Delphi? If that's the case I would expect the behavior to be identical. If the problem persists can you please attach a simple example project we can run "as-is" to reproduce the problem here?
Thanks in advance.


